CryptoURANUS Economics

Anti-AdBlocker

Saturday, August 11, 2018

Trading Volume: Defined in CryptoCurrency


Trading Volume: Defined


Trading Volume is the number assets (stocks, currency, etc.) being bought and sold over a period of time. Volume can be separated into “buy volume” (also known as “ask volume”) and “bid volume” (also known as “sell volume”).

Because assets are bought and sold by many thousands of investors, there isn’t a single price, instead there’s a range of prices:

  1. Some sellers hope to sell quickly at $5,000 and others hope to sell more profitably at $6,000.
  2. Some buyers hope to buy immediately at $5,000 and other buyers hope to buy more affordably at $4,000.

When an asset has a lot of buy volume also known as ask volume, it means there are many, many buyers who want to purchase and are will to pay high prices. They will start purchasing at the lowest selling price, followed by the next higher selling price, followed by the next higher selling price, followed by the next higher… In other words, a lot of buy/ask volume results in higher prices.

When an asset has a lot of sell volume also known as bid volume, it means there are many, many sellers who are willing to sell at low prices just to get rid of their assets. They will start selling at the highest purchasing price, followed by the next lower purchasing price, followed by the next lower purchasing price, followed by the next lower… In other words, a lot of sell/bid volume results in lower prices.


UNDERSTANDING CRYPTOCURRENCY TRADING VOLUME


Along with circulating supply and market capitalization, volume is one of the most prominent metrics in crypto. Within our premium, members-only Coinist Insiders Network, our job is to identify early stage cryptocurrencies with a high probability for success before there is any retail hype around them. We look at a coin’s trading volume before we decide to shortlist a project for further analysis. Below we’ll break down why trading volume is such an important metric when analyzing cryptos and how it can help you show a coin’s direction.

The volume of a token listed on CoinMarketCap is quite simple. It’s the amount of the coin that has been traded in the last 24 hours. For example, roughly $3.5 billion worth of Bitcoin has changed hands in the last day. You can break this down in a variety of ways; you could also list it as 3,039,787,668 Euros. Or, in crypto terms, 642,566 Bitcoins. You can also slice and dice it by exchange. In the last 24 hours, roughly 14.97% of all Bitcoin traded moved through Bitfinex, where the price is $5514 as of writing. Essentially, volume underscores how many people are buying and selling the coin. If the price of Bitcoin goes up and it shows a hefty volume, that tells us lots of people are making moves. Thus, it will likely keep going up. If the price of Bitcoin drops, but there’s minimal volume, that could tell us only a small amount of people back the trend. Let’s go into more detail on the ramifications.

Volume is arguably the most important metric for a cryptocurrency, because of the amount of ways it can be broken down. From volume, you can infer the direction and movements of a coin. It’s an essential metric for traders. Volume can examined in minute detail. You can track volume on CoinMarketCap by the last 24 hours, last week, or last 30 days. This helps reveal if a coin’s recent swings are an aberration or the norm. A coin with frequent heavy movements won’t attract attention if it has high volume. If a coin normally has less volume, heavy trading in the last 24 hours could indicate there’s some support behind the move it may be making.

You can also examine which exchanges had what volume. This matters because exchanges frequently have different prices. As well, many exchanges are geographically-focused. Kraken, for instance, is largely a European exchange. OKCoin functioned in China until the People’s Bank of China cracked down recently. Volume by exchange can reveal where the buyers or sellers of a coin are. CoinMarketCap does not, however, reflect exchanges with no fees. Exchanges that don’t charge a fee allow traders and bots to send coins back and forth for free, imitating a high volume.

Generally, the biggest and most popular coins are traded the most. If you sort by volume on CoinMarketCap, the top three coins are Bitcoin, Etherum, and Ripple, also the three largest market caps. No surprises there. But if you slide down a bit, you’ll see MonaCoin, a lesser-known currency, having higher trading volume than big names like Neo and Dash. MonaCoin isn’t much talked about, but it’s seen a remarkable 86.97% change in the last 24 hours. Coupled with a high trading volume, that’ll attract plenty of attention.

Comparatively, if we sort by lowest 24 hour trading volume in the top 100, Dentacoin pops up. It’s seen a 26.25% increase in the last 24 hours. That looks great on paper. But the low volume could make investors cautious. It might mean that the move won’t last, and that Dentacoin could soon see a correction. Of course, there’s no way to know for certain. Comparing the 1 day volume to the 7 day volume is another way we can read trends. Around $3.6 billion of Bitcoin was traded in the last 24 hours. Around $12.3 billion Bitcoin moved total in the last seven days. Almost a quarter of Bitcoin’s 7 day volume occurred yesterday. This tells us that yesterday was a massive trading day, which isn’t likely to repeat. On the other hand, you truly never know in crypto.

Cryptocurrencies are so different from established securities that there’s limited usefulness in comparing metrics. Since tokens don’t produce financial statements, they have relatively few metrics to start with. But we’ll compare cryptocurrency trading volumes to provide a sense of scale. In the last 24 hours, around $3.6 billion of Bitcoin was traded, as the price hit all-time highs. Comparatively, around $1.3 billion of Ethereum was traded. There’s quite a drop-off from there to Ripple, which saw $410 million change hands. But cryptocurrencies are already vastly more traded than conventional stocks. Apple trades roughly $4 billion a day in volume. For now, that remains ahead of the largest cryptocurrencies, but Bitcoin’s volume is knocking on the door. The higher trading volume of cryptocurrencies is one reason they fluctuate so drastically.

For traders, volume hints at sustainability of a given move. A drastic price increase with low volume might be fool’s gold. A drop with considerable volume behind it might mean a coin is in for an extended bear run. There are no certainties in cryptocurrency. But effectively assessing volume is an important tool in an investor’s belt.


InvestoPedia.com definition:


What is 'Volume':

Volume is the number of shares or contracts traded in a security or an entire market during a given period of time. For every buyer, there is a seller, and each transaction contributes to the count of total volume. That is, when buyers and sellers agree to make a transaction at a certain price, it is considered one transaction. If only five transactions occur in a day, the volume for the day is five.

Volume as Indicator 'Volume':

Volume is an important indicator in technical analysis as it is used to measure the relative worth of a market move. If the markets make a strong price movement, then the strength of that movement depends on the volume for that period. The higher the volume during the price move, the more significant the move.

Fundamental analysis is based on company performance and is used to determine which stock to buy. Technical analysis is based on price and is used to determine when to buy. Technical analysts are primarily looking for entry and exit price points, and volume levels provide clues about where the best entry and exit points are located.

Volume Trends Confirm Strength:

Volume is one of the most important measures of strength for traders and technical analysts. Put simply, volume refers to the number of contracts traded. For any trade to occur, the market needs to produce a buyer and a seller. A transaction occurs when buyers and sellers meet and is referred to as the market price. From an auction perspective, when buyers and sellers become particularly active at a certain price, it means there is a lot of volume.

Fundamental analysis:

is based on company performance and is used to determine which stock to buy. Technical analysis is based on price and is used to determine when to buy. Technical analysts are primarily looking for entry and exit price points, and volume levels provide clues about where the best entry and exit points are located.

Volume Trends Confirm Strength:

Volume is one of the most important measures of strength for traders and technical analysts. Put simply, volume refers to the number of contracts traded. For any trade to occur, the market needs to produce a buyer and a seller. A transaction occurs when buyers and sellers meet and is referred to as the market price. From an auction perspective, when buyers and sellers become particularly active at a certain price, it means there is a lot of volume.

Volume Analysts:

Analysts: use bar charts to quickly determine the level of volume. Bars also provide easier identification of trends in volume. When bars are higher than average, it is a sign of high volume or strength at a particular market price. In this way, analysts use volume as a way to confirm a price movement. If volume increases when the price moves up or down, it is considered a price movement with strength.

Trade Volume by Example:

If traders want to confirm a reversal on a level of support, or floor, they look for high buying volume. Conversely, if traders are looking to confirm a break in the level of support, they look for low volume from buyers. If traders want to confirm a reversal on a level of resistance, or ceiling, they look for high selling volume. Conversely, if traders are looking to confirm a break in the level of support, they look for high volume from buyers.

Volatility: Defined in CryptoCurrency


Volatility: Defined in CryptoCurrency


Volatility is the measurement of how much the price of an asset is likely to change over a period of time. Stocks for established companies like Apple and Google have a much lower volatility than cryptocurrencies which may change a lot in one day.

Volatility is a translation of what has cemented cryptocurrencies into internet indexing, since they exploded into the mainstream investor market has been their volatility.


The cryptocurrency market has also felt the ill effects of Bitcoin’s volatility because as a result of the price drops, Bitcoin’s trading volume, and even interest in the digital currency realm also decreases.


The danger is that volatility can cause a large exodus of investors to occur which severely dents the hopes of other cryptocurrencies gaining mass adoption status.

Volatility should be at the center of attention if there is to be a future in which crypto is used widely in day-to-day instances.


Volatility (finance)


The VIX In finance, volatility (symbol σ) is the degree of variation of a trading price series over time as measured by the standard deviation of logarithmic returns.

Historic volatility measures a time series of past market prices. Implied volatility looks forward in time, being derived from the market price of a market-traded derivative (in particular, an option).

Volatility terminology

Volatility as described here refers to the actual volatility, more specifically:
  • actual current volatility of a financial instrument for a specified period (for example 30 days or 90 days), based on historical prices over the specified period with the last observation the most recent price.
  • actual historical volatility which refers to the volatility of a financial instrument over a specified period but with the last observation on a date in the past
    • near synonymous is realized volatility, the square root of the realized variance, in turn calculated using the sum of squared returns divided by the number of observations.
  • actual future volatility which refers to the volatility of a financial instrument over a specified period starting at the current time and ending at a future date (normally the expiry date of an option).

Now turning to implied volatility, we have:
  • historical implied volatility which refers to the implied volatility observed from historical prices of the financial instrument (normally options)
  • current implied volatility which refers to the implied volatility observed from current prices of the financial instrument
  • future implied volatility which refers to the implied volatility observed from future prices of the financial instrument

For a financial instrument whose price follows a Gaussian random walk, or Wiener process, the width of the distribution increases as time increases. This is because there is an increasing probability that the instrument's price will be farther away from the initial price as time increases. However, rather than increase linearly, the volatility increases with the square-root of time as time increases, because some fluctuations are expected to cancel each other out, so the most likely deviation after twice the time will not be twice the distance from zero.
Since observed price changes do not follow Gaussian distributions, others such as the Lévy distribution are often used.[1] These can capture attributes such as "fat tails". Volatility is a statistical measure of dispersion around the average of any random variable such as market parameters etc.

Mathematical definition

For any fund that evolves randomly with time, the square of volatility is the variance of the sum of infinitely many instantaneous rates of return, each taken over the nonoverlapping, infinitesimal periods that make up a single unit of time.
Thus, "annualized" volatility σannually is the standard deviation of an instrument's yearly logarithmic returns.[2]
The generalized volatility σT for time horizon T in years is expressed as:
{\displaystyle \sigma _{\text{T}}=\sigma _{\text{annually}}{\sqrt {T}}.}
Therefore, if the daily logarithmic returns of a stock have a standard deviation of σdaily and the time period of returns is P in trading days, the annualized volatility is
{\displaystyle \sigma _{\text{P}}=\sigma _{\text{daily}}{\sqrt {P}}.}
A common assumption is that P = 252 trading days in any given year. Then, if σdaily = 0.01, the annualized volatility is
{\displaystyle \sigma _{\text{annually}}=0.01{\sqrt {252}}=0.1587.}
The monthly volatility (i.e., T = 1/12 of a year or P = 252/12 = 21 trading days) would be
\sigma _{{\text{monthly}}}=0.1587{\sqrt  {{\tfrac  {1}{12}}}}=0.0458.
{\displaystyle \sigma _{\text{monthly}}=0.01{\sqrt {\tfrac {252}{12}}}=0.0458.}
The formulas used above to convert returns or volatility measures from one time period to another assume a particular underlying model or process. These formulas are accurate extrapolations of a random walk, or Wiener process, whose steps have finite variance. However, more generally, for natural stochastic processes, the precise relationship between volatility measures for different time periods is more complicated. Some use the Lévy stability exponent α to extrapolate natural processes:
\sigma _{T}=T^{{1/\alpha }}\sigma .\,
If α = 2 you get the Wiener process scaling relation, but some people believe α < 2 for financial activities such as stocks, indexes and so on. This was discovered by Benoît Mandelbrot, who looked at cotton prices and found that they followed a Lévy alpha-stable distribution with α = 1.7. (See New Scientist, 19 April 1997.)

Volatility origin

Much research has been devoted to modeling and forecasting the volatility of financial returns, and yet few theoretical models explain how volatility comes to exist in the first place.
Roll (1984) shows that volatility is affected by market microstructure.[3] Glosten and Milgrom (1985) shows that at least one source of volatility can be explained by the liquidity provision process. When market makers infer the possibility of adverse selection, they adjust their trading ranges, which in turn increases the band of price oscillation.[4]

Volatility for investors

Investors care about volatility for at least eight reasons:
  1. The wider the swings in an investment's price, the harder emotionally it is to not worry;
  2. Price volatility of a trading instrument can define position sizing in a portfolio;
  3. When certain cash flows from selling a security are needed at a specific future date, higher volatility means a greater chance of a shortfall;
  4. Higher volatility of returns while saving for retirement results in a wider distribution of possible final portfolio values;
  5. Higher volatility of return when retired gives withdrawals a larger permanent impact on the portfolio's value;
  6. Price volatility presents opportunities to buy assets cheaply and sell when overpriced;
  7. Portfolio volatility has a negative impact on the compound annual growth rate (CAGR) of that portfolio
  8. Volatility affects pricing of options, being a parameter of the Black–Scholes model.
In today's markets, it is also possible to trade volatility directly, through the use of derivative securities such as options and variance swaps. See Volatility arbitrage.

Volatility versus direction

Volatility does not measure the direction of price changes, merely their dispersion. This is because when calculating standard deviation (or variance), all differences are squared, so that negative and positive differences are combined into one quantity. Two instruments with different volatilities may have the same expected return, but the instrument with higher volatility will have larger swings in values over a given period of time.
For example, a lower volatility stock may have an expected (average) return of 7%, with annual volatility of 5%. This would indicate returns from approximately negative 3% to positive 17% most of the time (19 times out of 20, or 95% via a two standard deviation rule). A higher volatility stock, with the same expected return of 7% but with annual volatility of 20%, would indicate returns from approximately negative 33% to positive 47% most of the time (19 times out of 20, or 95%). These estimates assume a normal distribution; in reality stocks are found to be leptokurtotic.

Volatility over time

Although the Black Scholes equation assumes predictable constant volatility, this is not observed in real markets, and amongst the models are Emanuel Derman and Iraj Kani's[5] and Bruno Dupire's local volatility, Poisson process where volatility jumps to new levels with a predictable frequency, and the increasingly popular Heston model of stochastic volatility.[6]
It is common knowledge that types of assets experience periods of high and low volatility. That is, during some periods, prices go up and down quickly, while during other times they barely move at all.[7]
Periods when prices fall quickly (a crash) are often followed by prices going down even more, or going up by an unusual amount. Also, a time when prices rise quickly (a possible bubble) may often be followed by prices going up even more, or going down by an unusual amount.
Most typically, extreme movements do not appear 'out of nowhere'; they are presaged by larger movements than usual. This is termed autoregressive conditional heteroskedasticity. Whether such large movements have the same direction, or the opposite, is more difficult to say. And an increase in volatility does not always presage a further increase—the volatility may simply go back down again.
The risk parity weighted volatility of the three assets Gold, Treasury bonds and Nasdaq (Worldvolatility.com) acting as proxy for the Marketportfolio seems to have a low point at 4% after turning upwards for the 8th time since 1974 at this reading in the summer of 2014.worldvolatility.com

Alternative measures of volatility

Some authors point out that realized volatility and implied volatility are backward and forward looking measures, and do not reflect current volatility. To address that issue an alternative, ensemble measure of volatility was suggested.[8] This measure is defined as the standard deviation of ensemble returns instead instead of time series of returns.

Implied volatility parametrisation

There exist several known parametrisation of the implied volatility surface, Schonbucher, SVI and gSVI.[9]

Crude volatility estimation

Using a simplification of the above formula it is possible to estimate annualized volatility based solely on approximate observations. Suppose you notice that a market price index, which has a current value near 10,000, has moved about 100 points a day, on average, for many days. This would constitute a 1% daily movement, up or down.
To annualize this, you can use the "rule of 16", that is, multiply by 16 to get 16% as the annual volatility. The rationale for this is that 16 is the square root of 256, which is approximately the number of trading days in a year (252). This also uses the fact that the standard deviation of the sum of n independent variables (with equal standard deviations) is √n times the standard deviation of the individual variables.
The average magnitude of the observations is merely an approximation of the standard deviation of the market index. Assuming that the market index daily changes are normally distributed with mean zero and standard deviation σ, the expected value of the magnitude of the observations is √(2/π)σ = 0.798σ. The net effect is that this crude approach underestimates the true volatility by about 20%.

Estimate of compound annual growth rate (CAGR)

Consider the Taylor series:
{\displaystyle \log(1+y)=y-{\tfrac {1}{2}}y^{2}+{\tfrac {1}{3}}y^{3}-{\tfrac {1}{4}}y^{4}+\cdots }
Taking only the first two terms one has:
{\mathrm  {CAGR}}\approx {\mathrm  {AR}}-{\tfrac  {1}{2}}\sigma ^{2}
Volatility thus mathematically represents a drag on the CAGR (formalized as the "volatility tax"). Realistically, most financial assets have negative skewness and leptokurtosis, so this formula tends to be over-optimistic. Some people use the formula:
{\mathrm  {CAGR}}\approx {\mathrm  {AR}}-{\tfrac  {1}{2}}k\sigma ^{2}
for a rough estimate, where k is an empirical factor (typically five to ten).

Criticisms of volatility forecasting models


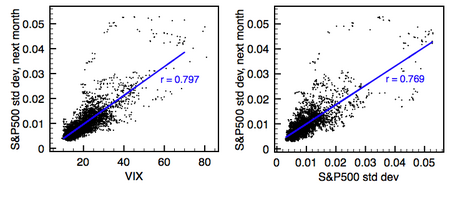
Performance of VIX (left) compared to past volatility (right) as 30-day volatility predictors, for the period of Jan 1990-Sep 2009. Volatility is measured as the standard deviation of S&P500 one-day returns over a month's period. The blue lines indicate linear regressions, resulting in the correlation coefficients r shown. Note that VIX has virtually the same predictive power as past volatility, insofar as the shown correlation coefficients are nearly identical.

Despite the sophisticated composition of most volatility forecasting models, critics claim that their predictive power is similar to that of plain-vanilla measures, such as simple past volatility [10][11] especially out-of-sample, where different data are used to estimate the models and to test them.[12] Other works have agreed, but claim critics failed to correctly implement the more complicated models.[13] Some practitioners and portfolio managers seem to completely ignore or dismiss volatility forecasting models. For example, Nassim Taleb famously titled one of his Journal of Portfolio Management papers "We Don't Quite Know What We are Talking About When We Talk About Volatility".[14] In a similar note, Emanuel Derman expressed his disillusion with the enormous supply of empirical models unsupported by theory.[15] He argues that, while "theories are attempts to uncover the hidden principles underpinning the world around us, as Albert Einstein did with his theory of relativity", we should remember that "models are metaphors – analogies that describe one thing relative to another".

Volatility hedge funds

Well known hedge fund managers with expertise in trading volatility include Mark Spitznagel and Nassim Nicholas Taleb of Universa Investments, Paul Britton of Capstone Holdings Group,[16] Andrew Feldstein of Blue Mountain Capital Management,[17] and Nelson Saiers from Saiers Capital.[18]

Virgin Bitcoin: Defined in CryptoCurrency

Virgin Bitcoin: Defined in CryptoCurrency


Virgin bitcoin is an amount of brand new bitcoin created by a computer that was mining. 

Mining is a computer process of recording and verifying information on the digital record known as the blockchain.

In bitcoin and other cryptocurrencies, mining also requires computers compete with each other to solve a complicated math problem.

A reward is given to the computer that solved the math problem first and this is known as virgin bitcoin.

A Bitcoin that has been received by a miner as a block reward, and thus has never been “spent” before. There is no benefit to a Bitcoin being a virgin Bitcoin.

Venture capital (VC): Defined in CryptoCurrency


Venture capital (VC): Defined


Venture Capital:

ven·ture cap·i·tal ˈvenCHər ˌkapədl/ noun:
Venture capital (VC): Is invested in a project in which there is a substantial element of risk, typically a new or expanding business.

Definition: A venture capitalist: 

A Venture capitalist is a person who invests in a business venture(s), providing capital for start-up or expansion of a business and by method of giving USD currency.  Their business is to pool investment funds and find and invest in businesses that are going to provide their investors high rates of return. 


Posted - Dec 7, 2017: Jun 14, 2018: Venture capital (VC) is financial capital provided to start-up companies with currency. It comes either from individual investors or specialised venture capital funds

The idea behind venture capital is to gain equity in the start-up companies. Often, the start-ups pursue new ideas, such as in the Internet or in biotechnology.
 
Venture capital is money provided to new companies that hold a promise of long-term growth.

In exchange for the money, the companies will share ownership.

Because they are new companies and have no history of success, they usually have a higher risk of failure.

WolfGang Preston: Those firms hold crypto assets — most of which is in Bitcoin — in order to invest and divest in company tokens and cryptocurrencies as part of ICOs or just generally as retail investors do. ...
 

Bronson Teare: Venture Network is a very different animal to both traditional venture firms and to crypto funds.

Posted - Aug 16, 2018:  
Crypto hedge fund: Pantera Capital is seeking to raise $175 million for its third venture fund, a staggering three-fold increase from its previous fund target. ... Another is a venture fund that targets already-listed crypto assets, using machine learning as well as input from the fund's partners to optimize investments.


What is Venture Capital?


It is private or institutional currency investment made into early-stage(s) / start-up companies (new ventures).

As defined, ventures involve risk (having uncertain outcome) in the expectation of a sizeable gain.

Defined, Venture capital (VC) is money invested in businesses that are small; or exist only as an initiative, but have huge potential to grow.

The people who invest this money are called Venture Capitalists (VCs).

The venture capital investment is made when a venture capitalist buys shares of such a company and becomes a financial partner in the business.

All Venture capital (VC) investment is also referred to risk capital or patient risk capital, as it includes the risk of losing the money if the venture doesn’t succeed and takes medium to long term period for the investments to fructify.

Venture capital (VC): typically comes from institutional investors and high net worth individuals and is pooled together by dedicated investment firms.

It is the USD currency provided by an outside investor to finance a new, growing, or troubled business. 

The venture capitalist provides the funding knowing that there’s a significant risk associated with the company’s future profits and cash flow.

Capital is invested in exchange for an equity stake in the business rather than given as a loan.

This is why Venture capital (VC) is a suitable option for funding a costly capital source for companies and most for businesses having large up-front capital requirements which have no other cheap alternatives.

Software and other intellectual property are generally the most common cases whose value is unproven. That is why; Venture capital funding is most widespread in the fast-growing technology and biotechnology fields.


Features of Venture Capital investments:

  • High Risk
  • Lack of Liquidity
  • Long term horizon
  • Equity participation and capital gains
  • Venture capital investments are made in innovative projects
  • Suppliers of venture capital participate in the management of the company

Methods of Venture capital financing:

  • Equity
  • participating debentures
  • conditional loan


THE FUNDING PROCESS: 


Approaching a Venture Capital for funding as a Company:


The venture capital funding process typically involves four phases in the company’s development:

  • Idea generation
  • Start-up
  • Ramp up
  • Exit 

Step 1: Idea generation and submission of the Business Plan:


The initial step in approaching a Venture Capital is to submit a business plan. The plan should include the below points: 
  • There should be an executive summary of the business proposal
  • Description of the opportunity and the market potential and size
  • Review on the existing and expected competitive scenario
  • Detailed financial projections
  • Details of the management of the company

Businesses with low capital source must have a detailed analysis done of the submitted financial plan for venture partnering funds granted or loaned by the Venture Capitalist (VCs) to decide whether to take up the project or not.


Step 2: Introductory Meeting:


Once the preliminary business analysis study is done by the Venture capital (VC).

The (VC) judges the project as per their wants/needs of desired preferences, there is a one-to-one meeting that is called for discussing the project in detail after the submission is read over firstly.

This is when the business asking for Venture capital (VC) investor's financial backing becomes a win-all or fail and their presentation must be perfect.

After the meeting the (VC) finally decides whether or not to move forward to the due diligence stage of the process.

Step 3: Due Diligence:


The due diligence phase varies depending upon the nature of the business proposal given to the Venture capital (VC) for financial backing.

This process involves making solvent the queries related to customer references, product and quality of their business strategy evaluations, all management interviews, and other mediary exchanges of information during this time period among (VCs).

Step 4: Term Sheets and Funding:

If the due diligence phase is satisfactory, the VC offers a term sheet, which is a non-binding document explaining the basic terms and conditions of the investment agreement with possible punishments and rewards buried in legal jargon.

A businesses must be of an absolute legal sound mind by statutes and mediations of law in all regards before such ventures.

The term sheet is generally negotiable and must be agreed upon by all parties, after which on completion of legal documents and legal due diligence, funds are made available in partial and-or full.

Types of Venture Capital funding:


The various types of Venture capital (VC) are classified as per their applications at various stages of a business.

The three principal types of venture capital are early stage financing, expansion financing and acquisition/buyout financing.

The venture capital funding procedure gets complete in six stages of financing corresponding to the periods of a company’s development:
  • Seed money: Low level financing for proving and fructifying a new idea.
  • Start-up: New firms needing funds for expenses related with marketingand product development.
  • First-Round: Manufacturing and early sales funding.
  • Second-Round: Operational capital given for early stage companies which are selling products, but not returning a profit.
  • Third-Round: Also known as Mezzanine financing, this is the money for expanding a newly beneficial company.
  • Fourth-Round: Also calledbridge financing, 4th round is proposed for financing the "going public" process.

A) Early Stage Financing:


Early stage financing has three sub divisions seed financing, start up financing and first stage financing.

  • Seed financing: is defined as a small amount that an entrepreneur receives for the purpose of being eligible for a start up loan.
  • Start up financing: is given to companies for the purpose of finishing the development of products and services.
  • First Stage financing: Companies that have spent all their starting capital and need finance for beginning business activities at the full-scale are the major beneficiaries of the First Stage Financing. 

B) Expansion Financing:


Expansion financing is categorized into second-stage financing, bridge financing and third stage financing or mezzanine financing.


Second-stage financing: is provided to companies for the purpose of beginning their expansion.

The method of Second Stage Financing is also known as Mezzanine Financing.

It is provided for the purpose of assisting a particular company to expand in specific and a major way.


Bridge Financing: may be provided as a short term interest only finance option as well as a form of monetary assistance to companies that employ the Initial Public Offers as a major business strategy.

C) Acquisition or Buyout Financing:

Acquisition or buyout financing is categorized into acquisition finance and management or leveraged buyout financing.


Acquisition Financing: assists a company to acquire certain parts or an entire company. Management or leveraged buyout financing helps a particular management group to obtain a particular product of another company and at times can be agressive.


Advantages of Venture Capital:

  • They bring wealth and expertise to the company.
  • Large sum of equity finance can be provided.
  • The business does not stand the obligation to repay the money.
  • In addition to capital, it provides valuable information, resources, technical. assistance to make a business successful.

Disadvantages of Venture Capital:

  • As the investors become part owners, the autonomy and control of the founder is lost.
  • It is a lengthy and complex process.
  • It is an uncertain form of financing.
  • Benefit from such financing can be realized in long run only.


Exit Route:

  • There are various exit options for Venture Capital to cash out their investment:
  • IPO.
  • Promoter buyback.
  • Mergers and Acquisitions.


Examples of venture capital funding:


Kohlberg Kravis & Roberts (KKR), A top-tier alternative investment asset managers in the world, has entered into a definitive agreement to invest USD150 million (Rs 962crore) in Mumbai-based listed polyester maker JBF Industries Ltd. The firm will acquire 20% stake in JBF Industries and will also invest in zero-coupon compulsorily convertible preference shares with 14.5% voting rights in its Singapore-based wholly owned subsidiary JBF Global Pte Ltd. The fundingprovided by KKR will help JBF complete the ongoing projects.

Pepperfry.com, India’s largest furniture e-marketplace, has raised USD100 million in a fresh round of funding led by Goldman Sachs and Zodius Technology Fund. Pepperfry will use the fundsto expand its footprint in Tier III and Tier IV cities by adding to its growing fleet of delivery vehicles. It will also open new distribution centres and expand its carpenter and assembly service network. This is the largest quantum of investmentraised by a sector focused e-commerce player in India.

Validation Nodes: Defined in CryptoCurrency


Validation Nodes: Defined


Validation Nodes are,

In TCP/IP Networking:

A node is a single stand-alone CPU/Computer running a specific software.

In Bitcoin Networking:

A node is a Bitcoin program which connects to other Bitcoin nodes, i.e. other Bitcoin programs on the same machine, or on other machines which can be across the street or on the other side of the planet.

There are several types and several versions of Bitcoin software.
By picking a specific version of a specific Bitcoin program, a user “votes” for certain changes in the Bitcoin protocol.


Example:

  • When bitcoin increases from 21 million total BTC to 42 million, the majority of the network is required to vote “yes” by installing the software implementing this change. 
  • Code changes are, thus, democratic.
  • The fact that there are very few Bitcoin nodes out there: a mere 10000 currently.
  • Neither number is very impressive from a global perspective. According to some calculations, running a Bitcoin node on AWS (Amazon’s cloud service) costs around $10 per month, and that is cheap.
  • To purchase 10000 brand new nodes takes $100,000 per month, andy $1.2m per year.
  • Regards any Bitcoin industrial miner company all gross in billions and unchecked by IRS should share the wealth, but are only greedy.
  • A list of node software you can install, along with their pros, cons, and special features, can be found here.
  • It’s important to note that validation nodes are purely an expense for the users running them. They give their users nothing.
  • CryptoCurrency nodes need around 500GB-to-1TB of disk space, 16GB-to-64GB of RAM, an uncapped internet connection with at least 1024kb of constant upload speed available just to run.
  • Currently, it is not uncommon to need to upload over 200 GB of traffic per month when running a single node.
  • Validation nodes are volunteer nodes.
  • Validation nodes are useful for the system’s decentralization.
  • Validation nodes become ever more expensive to run, and the number of nodes drop.
  • This mounting disillusion with Bitcoin’s theoretical decentralization due to the fact that bankers seem to have taken over the protocol’s of ASIC/Bitcoin.
  • The fact that Bitcoin’s price is being pumped by crime syndicates, government black projects, cabal of financial institutions.
  • with Bitcoin there is no surprise that the number of nodes dropped by 20% in a single month – from 12000 to 10000.
  • As more bitcoin nodes disappear, so does centralization.
  • This slow hostile takeover, becomes more and more obvious by the private financial institutions.
  • Private financial institutions always much to be admired.


Mining Nodes:

A mining node is a validation node which also uses the hardware of your own or a rented machine to guess the combinations of numbers and letters needed to validate and verify a block.

A mining node can team up with other nodes and send guesses to a common pool (pool mining) to increase chances of guessing, but then counts as only one node.


A mining node is the only bit of software which can “produce” new Bitcoin.

A cryptocurrency mining node is a network that resolves transactions needed to “seal” the cryptocurrency into complete coin blocks.

Validation-Nodes also processes emails, contacts, special sources of information, security checks, and produces new safe mediation of cryptocurrencies.

A validation node makes sure cryptocurrencies are all genuine coins, and passes the information along to other nodes, thus enabling the transfer of monetary value from location A to location B.


Mining nodes are a subset of other validation nodes on the cryptocurrency web-ring of servers, and every mining node is also a validation node and vise versa.


Unspent Transaction Output [UTXO]: Defined in CryptoCurrency


Unspent Transaction Output [UTXO]: Defined.


Unspent Transaction Output or UTXO, is defined as a list of money received that has not yet been spent. Bitcoin and other cryptocurrencies based on bitcoin’s technology use UTXO to verify that a person has unspent crypto available for spending.If you were to total up the UTXO, you would get the user’s available balance.


About UTXO's:


  • The Unspent Transaction Outputs / Also Known As / UTXO's are an interesting topic not spoken often enough in the bitcoin community.
  • An unspent transaction output (UTXO) is an output of a blockchain that has not been spent. -- i.e. used as an input in a new transaction.
  • Bitcoin is the most famous example of a cryptocurrency that uses the UTXO model.
  • Outputs are a superset of UTXOs.
  • UTXOs are a subset of the outputs superset.
  • Bitcoin UTXO lifespans have been studied.
  • Valid blockchain unspent outputs transactions may be used to effect further transactions.
  • The requirement is only unspent outputs may be used in further transactions is necessary to prevent double spending and fraud.
  • Inputs on a blockchain are deleted when a transaction occurs, whilst at the same time, outputs are created in the form of UTXOs.
  • These unspent transaction outputs can be used for the purpose of future transactions.
  • When bitcoin first became known, (UTXO), was considered pivotal.
  • Current day bitcoin community consider the HD wallets have no need understanding UTXOs as thoroughly.


What Is A UTXO In Present Day CryptoCurrencies?

  • A Bitcoin transaction is comprised of inputs and outputs.
  • Only Unspent Transaction Outputs, or UTXOs, can be used to be spent as an input in another transaction whereas spent outputs are already spent hence can’t be spent again. 
  • You will always need UTXO or an unspent transaction output to make a transaction workable.
    If you don’t have an  UTXO then you do not have any Bitcoin.
  • These are the protocol rules Satoshi Nakamoto had defined into Bitcoin to prevent double spending. 
  • There is no way in the bitcoin world to spend partial amounts while completing a transaction.

TA More In-depth Translation Is This: 

Problem: With a balance of 3 BTC on ‘XYZ’ public address and you pay 0.5 BTC to a merchant, you cannot send 0.5 out of your ‘XYZ’ address and keep the rest 2.5 BTC intact.


Solution: You need to spend the entire 3 BTC that you designate a 0.5 BTC to the merchant while providing a signature and sending the rest 2.5 BTC back to yourself on an address that you control.


Known-As: Sending $change to the change address.
  • In the dawn and beginning of Bitcoin a trader always made two transactions in your wallet when you pay someone. 
  • Yes, that’s true because modern wallets take care of everything behind the scenes.

When a bitcoin transaction takes place, there are two UTXOs created:
A.) One that is the actual coins sent to the recipient
...and...
B.) One that is the change output, which goes back to the sender’s wallet.


To clarify, the transaction above is done by the same person, confused yet?


This happens because HD wallets automatically send the change to a different change address so that you can secure your privacy. So next time you see your address changing, you know it is happening because you are receiving new UTXOs on a new change address!


Your Thoughts Are My Thoughts:


In earlier Bitcoin days, there were no deterministic wallets, BTC wallets used to ask for a change address if you were not the spending the whole balance in the initial transaction, failing which could result in your change being sent to addresses that you did not control resulting in loss of the transfering funds.


UTXO in depth:


  • More transactions means more memory for the UTXO database.
  • Many want to know what the UTXO database is.
  • UTXO is geek-speak for “unspent transaction output.” 
  • Unspent transaction outputs are important because fully validating nodes use them to figure out whether or not transactions are valid.
  • All inputs to a transaction must be in the UTXO database for it to be valid. 
  • If an input is not in the UTXO database, then either the transaction is trying to double-spend some bitcoins that were already spent or the transaction is trying to spend bitcoins that don’t exist.
  • The price of memory rises and drops every year. 
  • New memory chip technologies roll out we would still have the UTXO set growth outpacing the advance of technology keeping the not so wealthy poor.
  • Currently in 2018, the UTXO database is about 650MiB on disk, 4GB when decompressed into memory. DRAM costs about $too-much per GB, so you need to spend about $too-much on memory if you want absolute fastest access to the UTXO.
  • The UTXO continues to double and RAM prices continue to drop $% per year, next year you’ll have to spend about $more-Money.
  • Ten years from now may cost even more, perhaps.
  • The maximum block size will stop the exponential growth.
    A one megabyte block is room for about 100 million 500-byte transactions per year.
    If each one of these blocks increase in the UTXO then 500 bytes would grow in the UTXO Bd to 50 gigabytes a year. 
  • The worst case running nodes are those with not enoug ram.
  • More transactions with no changes would accelerate the UTXO Bd into more growth.
    With more UTXO Db growth will make purchasing RAM more expensive.
  • That is a very good reason to oppose increasing the maximum block size, because.
  • UTXO Db set does not have to be in DDR+RAM, but it can be stored on an SSD or spinning hard disk and the only reason why not is control over less wealthy.
  • The access of UTXO is not random.
  • The UTXO outputs recently spent will be re-spent outputs that have not been spent in a long time.
  • Bitcoin Core already has a multi-level UTXO cache, thanks to the hard work of Pieter Wuille.
  • Solid-state-disk (SSD) prices are about $to-much$ per GB, spinning disks are less $per GB$. 
  • Knowing how Bitcoin works is everything.